Food for Thought |How AI Could Improve Equality and Productivity in Tax Policies
In today’s world, the socio-economic impact of a country’s tax policy is more far-reaching than ever. The key objectives of a country’s tax policy are:
- To ensure an economically stable and consistently improving government body.
- To lessen the wealth inequality in the citizens of the county.
- To have a handle on the economic activity amongst the citizens of the country.
But, taking a look at the present-day world, we are seeing many countries unable to meet these goals. Sri Lanka is looking for funds from the IMF and has borrowed money from individual countries (including India and China) in an attempt to maintain a stable environment in the country. With declining forex reserves and growth in imports, Nepal is said to be next in line after Sri Lanka. Pakistan is seen by many as soon to be an economically failed state. So, based on this, we understand that taxation policies need to proactively ensure that we don’t end up in the same situation; they need to be fine-tuned for growth and the well-being of both individual citizens as well as the government.
AI for Taxation
With multiple iterations of design improvement and rigorous testing, we can stimulate the outcome of a modified taxation policy and its overall long- and short-term impact –thus arriving at the most efficacious taxation policy. This falls in line with the AI domain of Reinforcement Learning (RL). RL creates an environment or a simulation; in this case, this could be an economic environment similar to that of a country with complicated and competitive transactions across varied markets.
Multiple variations of AI algorithms known as agents try to optimally reach the objective of an equality productivity trade-off, with the economic environment rewarding each correct decision and penalizing incorrect steps. The agent with the largest improvement in the trade-off score (as compared to the country’s existing trade-off score) could then be explored further to gain insights and the same can be driven through a feedback loop involving citizens of the country.
Hence, we have a data-driven, trial-and-error approach that disregards any economic assumptions and allows both the reinforcement learning agents and the country’s government to quantify and balance the tradeoff between the equality of wealth and citizens’ productivity.
Actors in Reinforcement Learning
To devise an optimal taxation policy, we have two kinds of players in the RL algorithm:
- The government, which is referred to as the ‘policy maker’
- The citizens, who are referred to as the ‘agents’
Economic Environment for an Agent
This is a simulation, similar to the real country, where agents or citizens can move freely, collect assets, and build a house. An agent also can perform a transaction involving an exchange of some or all of their collected assets at a set price.
At the onset, each agent is allocated the same amount of initial money for equality. But thereafter – similar to a real-world scenario – their earnings might evolve, depending on that agent’s actions and skillset. An agent with an expensive skill will have higher earnings.
Also, while actions like performing a transaction or building a house act as wealth generators, all other actions incur a cost. Towards the end of the simulation, all agents are given an award based on their earnings and the costs incurred. This award reflects the agent’s ability to utilize the assets they’ve acquired. This Constant Relative Risk Aversion (CRRA) function is used to deduce the utility score.[1] It increases with an increase in earnings and linearly decreases as per costs incurred.
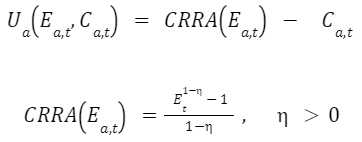
Here:
- Ea,t denotes the Earnings of an agent a at time t
- Ca,t denotes the Earnings of an agent a at time t
- η denotes the degree of linearity and remains constant for all agents in the simulation.
The following figure accurately describes the simulation environment from an agent’s point of view
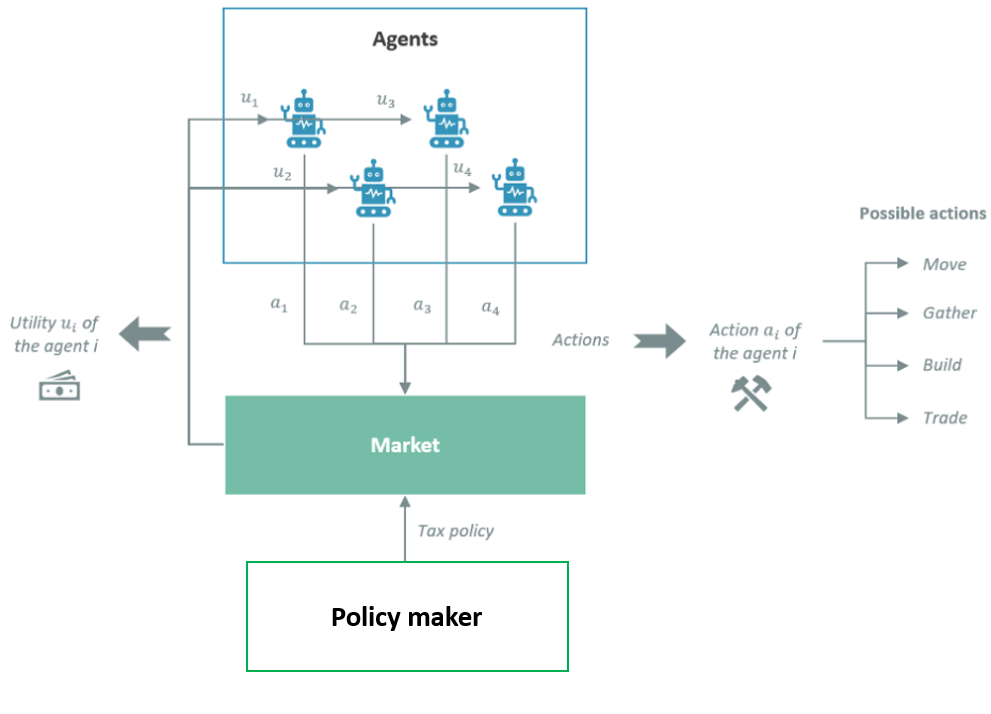
Source: AI-driven-tax-policy-what-it-would-look-like
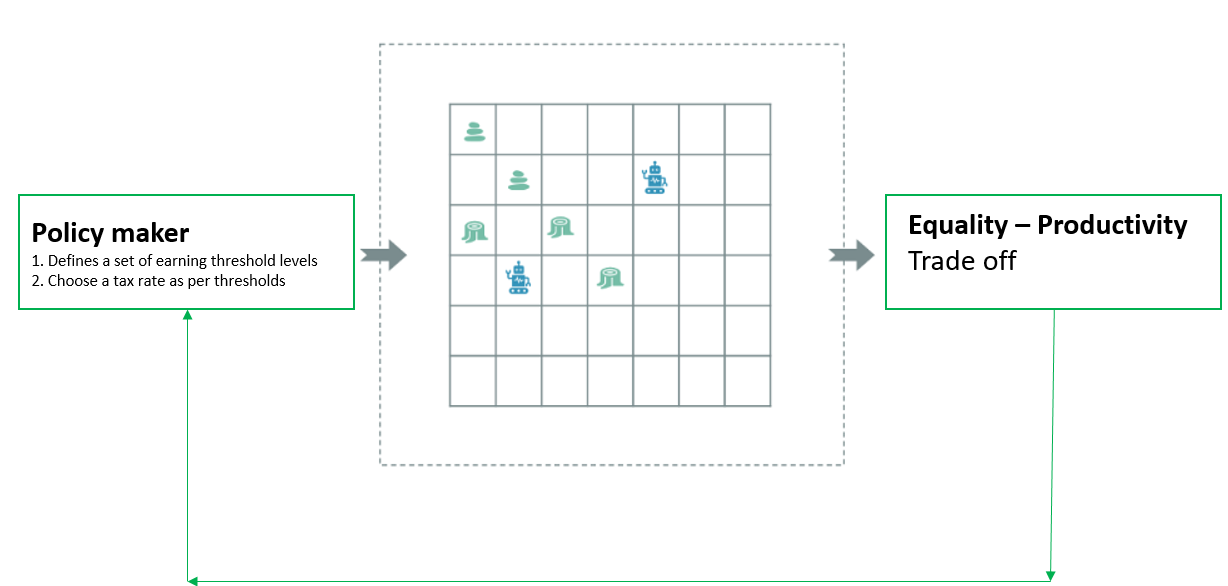
Economic Environment for the Policy Maker
Each simulation must contain more than one tax period (ideally between 5 to 20 periods) to confidently interpret the results of multiple iterations of taxation policies on the agents in the experiment. The baseline for the initial tax period could be similar to the country’s current taxation policy, wherein each agent must pay direct taxes in proportion to their earnings in the tax period. All the tax collected by the policy maker is then dispensed to the agents equally. The policy maker’s aim is to deduce the optimal tradeoff between equality of wealth and the productivity of the agents in simulations. This optimality can be measured as the EP (Equality-Productivity) score.
EP score = Equality * Productivity
Here Equality is derived as a complement of the Gini Index as follows:
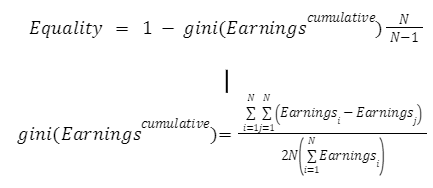
Where denotes the earnings of an agent i in tax period t in an environment with N unique agents.
The following figure accurately describes the simulation environment from an agent’s point of view
Source – AI-driven-tax-policy-what-it-would-look-like
The following figure holistically describes the simulation environment
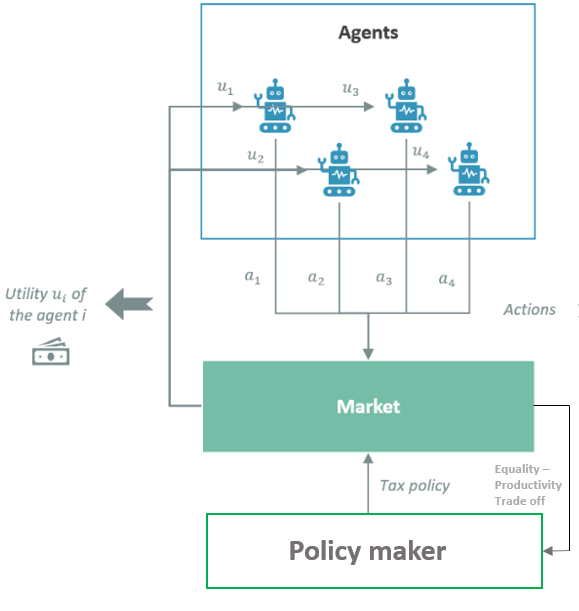
Source – AI-driven-tax-policy-what-it-would-look-like
Simulation Outcome
To get an adequately reliable result, the simulation must include a substantial number of agents across all groups of earning ranges i.e., the lowest-earning range, highest-earning range, lower middle-class earning range, and higher middle-class earning range. We do need to note here that this is a very simplistic form of simulation with pre-set prices and no scope of tax fraud, change in market conditions, or entry of new agents. Such an experiment would have its disadvantages; as an initiation exercise, the results will be achieved in a quicker and more adaptable format for the agents. In an experiment run by Stephan Zheng et al. [1], it was found that:
- Reinforcement Learning gave a better Equality – Productive score.
- It organically deduced a comparatively higher tax for high-earning individuals and a dip in taxes for middle-class earners.
- The agents were discovered to have comparatively more improvement in overall productivity in their skillset.
Conclusion
This study is expected to serve as a foundation for deriving more efficient ways to analyze the impact of a policy change. Although these algorithmic results could not mimic the exact society behavior, even in its limited form such techniques have great potential to transform policy making from a politically driven process to more data-driven, result-seeking one.
References
- The AI Economist: Improving Equality and Productivity with AI-Driven Tax Policies
- AI-driven-tax-policy-what-it-would-look-like
- The Three Goals of Taxation
- Why Sri-Lanka is facing unprecedented economic-crisis
- Viking Village – app on Google store
- Nepal’s economic crisis
- Pakistan in grip of intense and deep economic crisis
- Using elasticity to derive optimal tax rate
- The AI Economist
Authored by: Sidharth Suman, Senior Consultant at Absolutdata