Our client, one of the world’s most recognizable food, beverage, and nutrition leaders, wanted to migrate their existing reporting framework from its current platform to Tableau. But more was needed than a simple migration; they also wanted an integrated data mart that could harmonize data coming in from 14 sources (including APIs and FTPs) and act as a single source of truth for multiple brands. With this tool, they expected to reduce reporting turnaround time and increase the accuracy of their insights.
Centralized Media Dashboard Delivers Customized Analysis
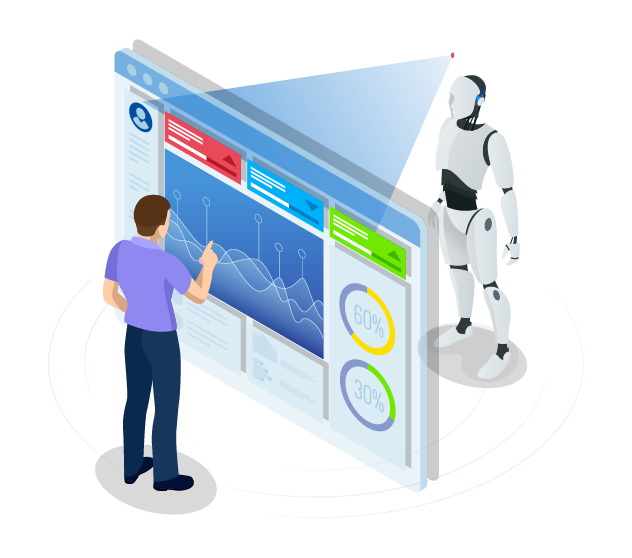
We developed a solution combining an intuitive dashboard with robust data extraction, transformation, and integration backend capabilities. Implementing this tool allowed the company to:

Reduce report turnarounds from 3-4 weeks per-analyst effort to 4 days.

Rely on a single source of truth for multiple brands’ sales and media marketing data.

Provide customized data slicing and dicing, and analysis
In addition, the fact that this solution was fully automated saved time and reduced human errors. The standardized report templates and customized design layouts kept the user experience clean and consistent for all.
A Real-Time View of the Data
Like most business dashboards, the real power of this project was in the data. It started with daily extractions of data (social media, search, marketing, digital ads, and analytics) from APIs and CSV/Excel files. We applied data engineering techniques to build a unified data warehouse to integrate all this data.
Next, we added automated ETL (Extract, Transform, Load) to load the existing data and then power a trickle feed and incremental data refreshes. This allowed teams to access the latest data without placing additional work on the IT team.
Finally, we used Tableau to develop customized reporting dashboards. These enabled business users to create data analyses with just a few clicks. Teams can do a deep dive into standard metrics at any level of detail and filter the results. We added more security by building precise role-based views and including predefined access rights. And because everything was hosted online, users could access this information from their mobile devices.

More Than Just Faster Analyses
Thanks to this solution, our client drastically reduced the reporting time but increased the accuracy of their results. Business users can view a customized dashboard filled with their most relevant KPI; they can also perform their own ad-hoc analyses with ultra-precise slicing and dicing of the data.


